
The result of a pressure difference measurement depends on the facade the meter is installed on. The windward wall and the leeward wall can show completely different readings at the same time. Before installation, microclimate simulation shows how the prevailing wind directions press on the different sides of the building, and it helps choose the measuring points so that the results can be interpreted.
Same building, different wall, different result
In the third part of our blog series, we tested how wind affects pressure difference measurement. We measured all four facades of the same building at the same time. On the windward wall the meter showed a greater negative pressure, and on the leeward wall the pressure difference became smaller or even turned into positive pressure, although the pressure indoors stayed almost the same.
The test had a second lesson too. The wind data came from an airport about 30 kilometres away, so no precise conclusions could be drawn about the direction and strength of the wind at the measured building. The surrounding buildings, trees and terrain change the wind right next to the building, and a distant weather station does not see it.
What microclimate simulation shows
Microclimate simulation is based on the building's actual location and surroundings. The shapes and positions of the buildings are generated from map data, and the movement of air around the buildings is computed with a physics-based model. The result shows:
- the prevailing wind directions and how much of the time each of them blows
- on which facades the wind causes positive pressure and on which negative pressure
- where the air accelerates, swirls or stands still, often at the corners of the building
- at which points the pressure varies the most
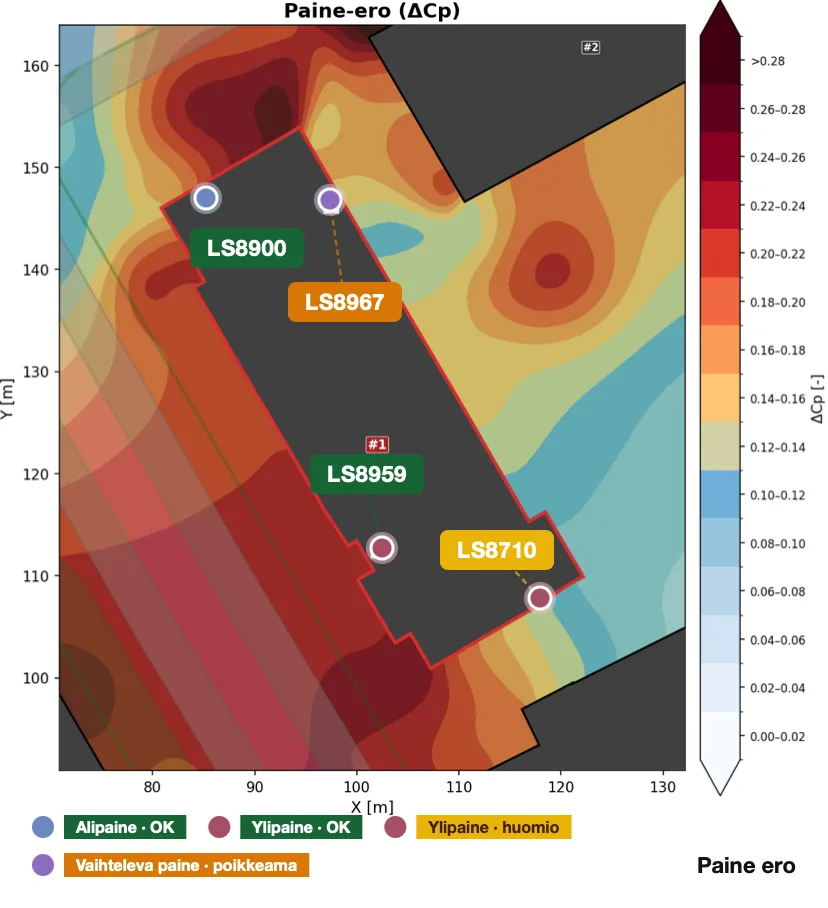
From simulation to a measurement plan
Once the simulation is done, the measuring points can be chosen from it rather than from the floor plan alone.
- The point of highest positive pressure: the facade that the prevailing wind presses on the most. There the wind pushes outdoor air into the structures, and the moisture risk is greatest.
- The point of highest negative pressure: the facade or corner where the wind draws out the most. There the structures are under suction.
- A comparison between two points: when the meters are at opposite extremes of the building, the difference between them tells the share of the wind. Whatever shows the same way in both comes from the ventilation or the temperature difference.
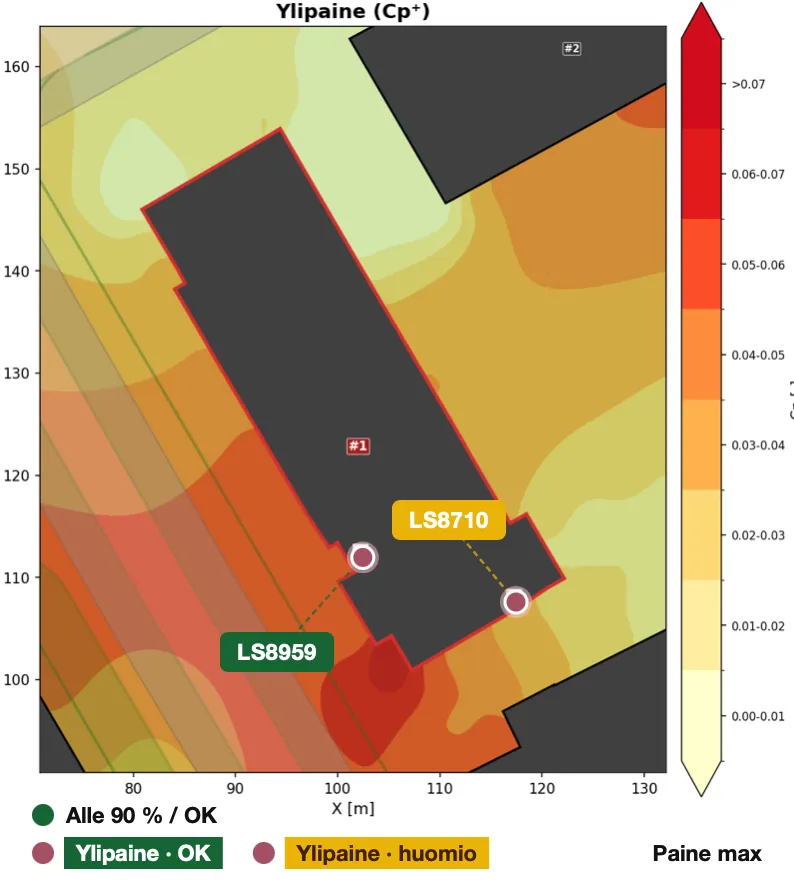
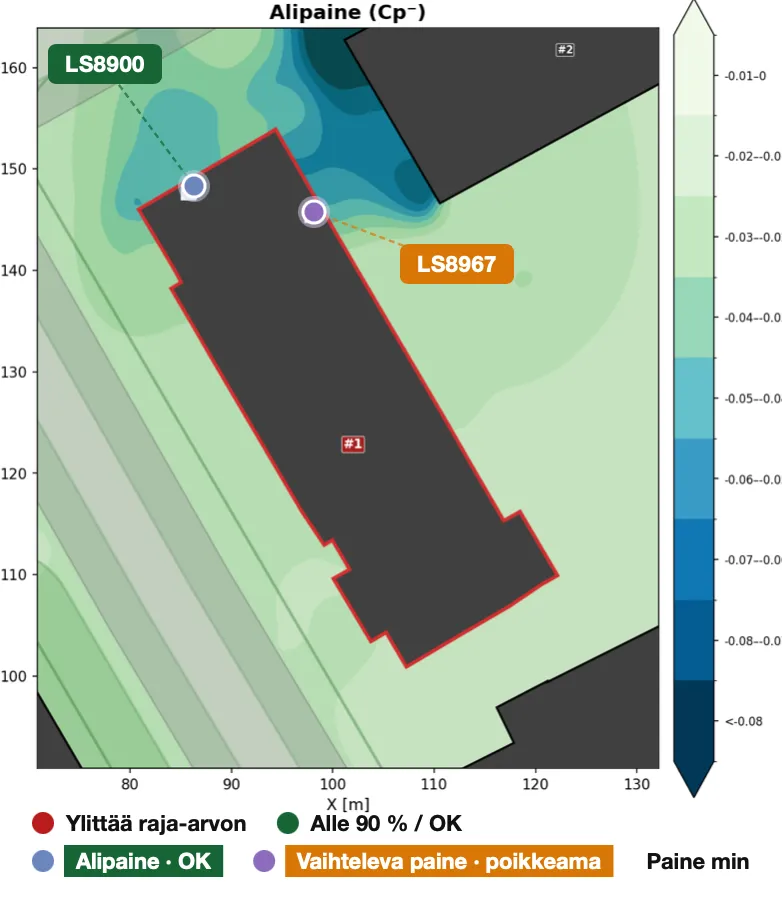
This way fewer meters are needed, and the background of every reading is known. When a measurement result deviates, you can check whether the wind was blowing from the simulation's prevailing direction at the time before looking for a fault in the ventilation.
Simulation and measurement support each other. Tuomas Alinikula of Granlund has compared the simulation with his own measurements, and the measurements have shown the same as the simulation.
“The simulation does not replace a detailed condition survey, but it quickly shows where further investigations should be focused.”
Tuomas Alinikula, Granlund Oy
All we need is the address
The simulation needs no source data and no modelling work from the client. It is enough to tell us the address of the property. The results are delivered as images from which the measuring points can be chosen before a single meter has been installed.
Read also how the placement and height of the meter affect the result.
Don't guess, measure.