WHY DO SOME FACADES DETERIORATE FASTER THAN OTHERS?
DO YOU KNOW WHAT IS REALLY HAPPENING IN YOUR BUILDING?
Not all properties are exposed to the same stress. The building's location, the surrounding buildings and the local wind conditions form a microclimate that can place exceptional stress on particular facades, corners or roof structures. These risks often go unnoticed because they cannot be seen with the naked eye or in conventional condition inspections.
Microclimate simulation makes these invisible conditions visible, property by property and fast.

Why is microclimate simulation worth doing?
MikroilmastoCFD · Flow animation
Identify risk areas quickly
A better basis for repair and maintenance decisions
An analysis for every property

Identify risk areas quickly
See which facades, corners and roof structures are most exposed to wind and pressure differences
Local risks come to light without extensive field studies
Less guesswork, more facts to support decisions

A better basis for repair and maintenance decisions
Repairs can be prioritised based on the actual stress
Avoid oversized solutions and solutions aimed at the wrong place
Supports long-term maintenance planning and the preparation of renovation projects

An analysis for every property
The surrounding buildings and the location make a decisive difference
The same solution does not work for every site
The simulation is always property-specific, not based on general assumptions

Easy to get started
All you need to do is enter the property's address
No data collection or modelling work required from the customer
The results are delivered as clear visualisations
How the microclimate is made visible
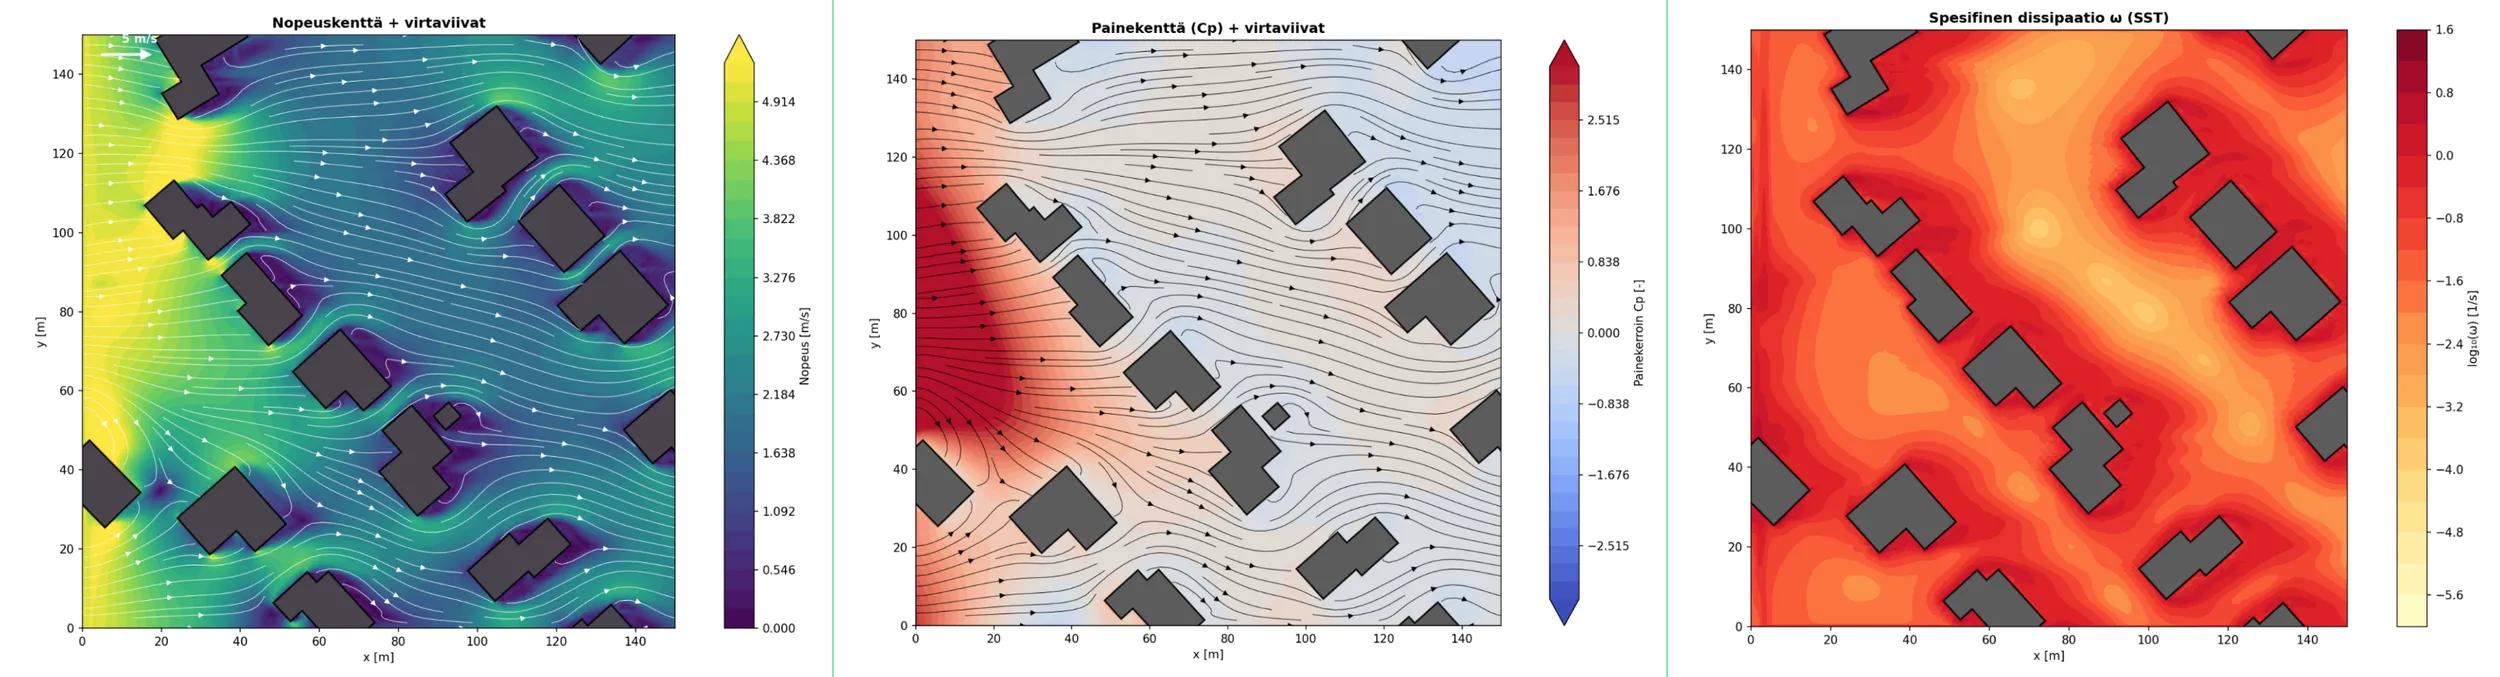
The simulation turns invisible air flows and stresses into clear images that make risk areas easy to identify.
Wind speed and air flows around the building
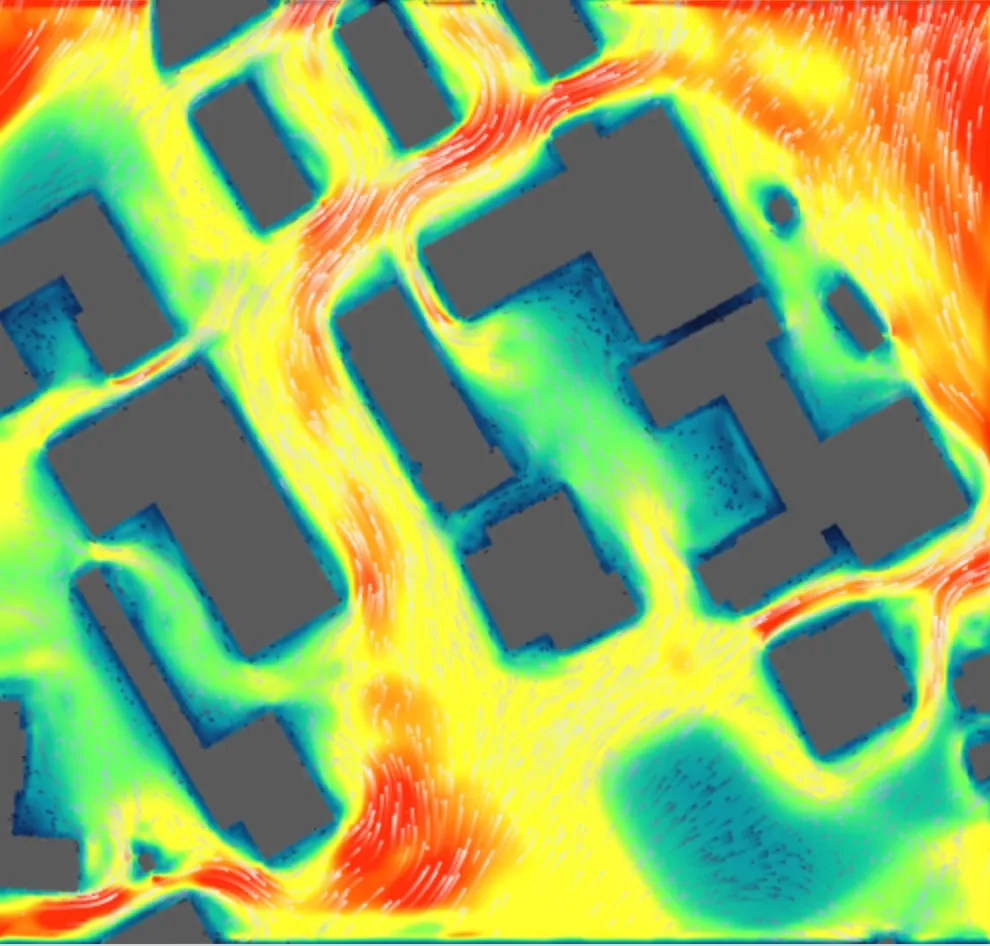
The colour scale shows the wind speed: red where the air flows fast, blue where the buildings give shelter. The streamlines reveal where the air accelerates, swirls or stops, often precisely at the corners and facades of the buildings.
Pressure differences affect how moisture moves and how structures are stressed. The simulation clearly shows which surfaces are under the greatest load.
Pressure on facades
Wind and stress zones
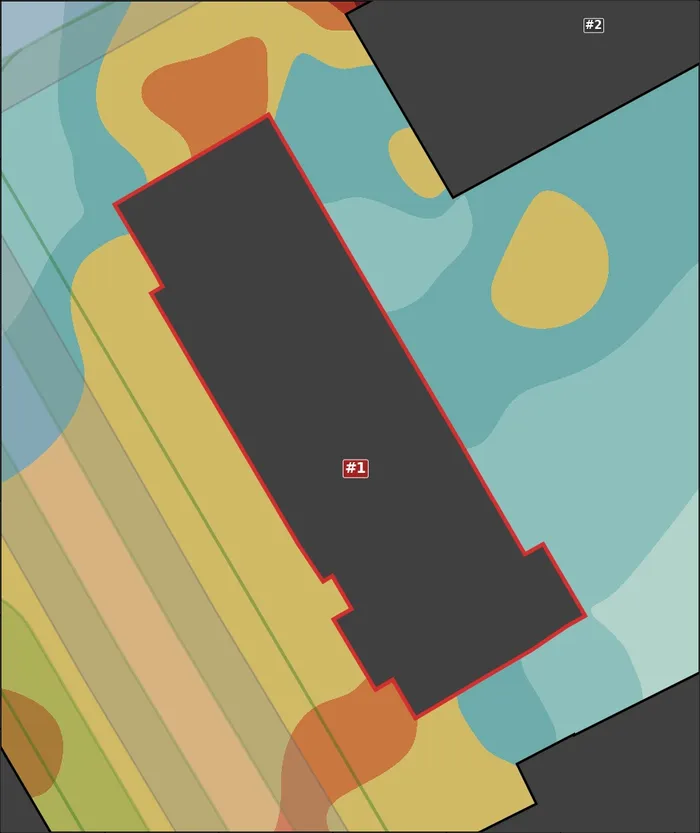
Overpressure, underpressure, pressure difference and wind exposure are combined into a single stress index. Where several factors are elevated in the same spot, the index rises, and the most stressed spots stand out in the darkest tone.
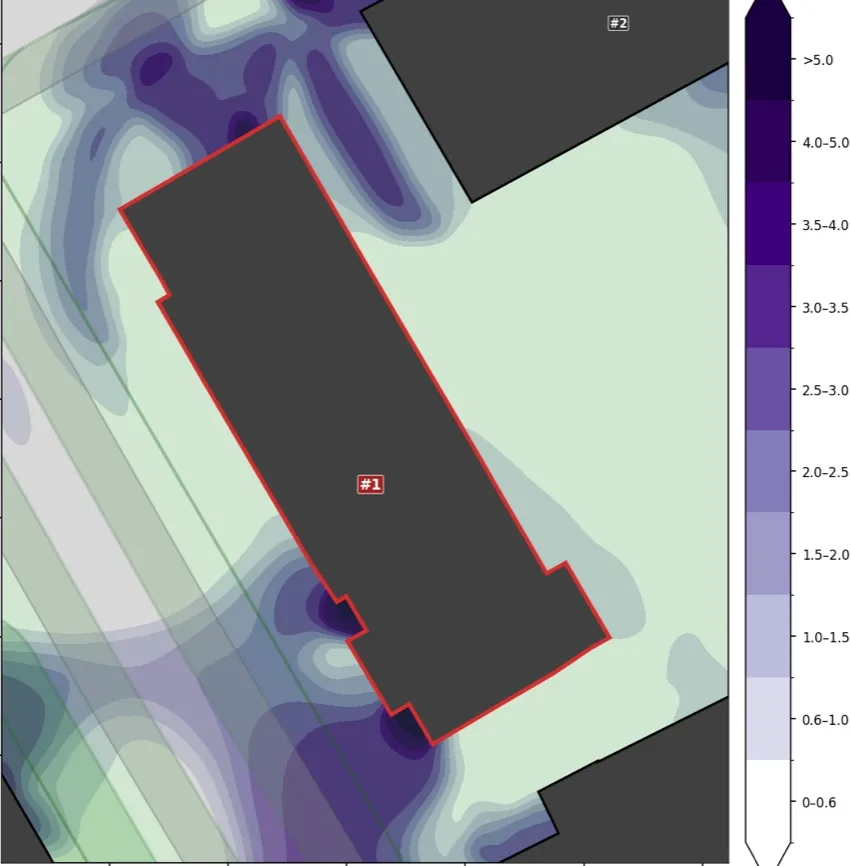
The visualisations are based on the property's actual location and surroundings, not on general assumptions
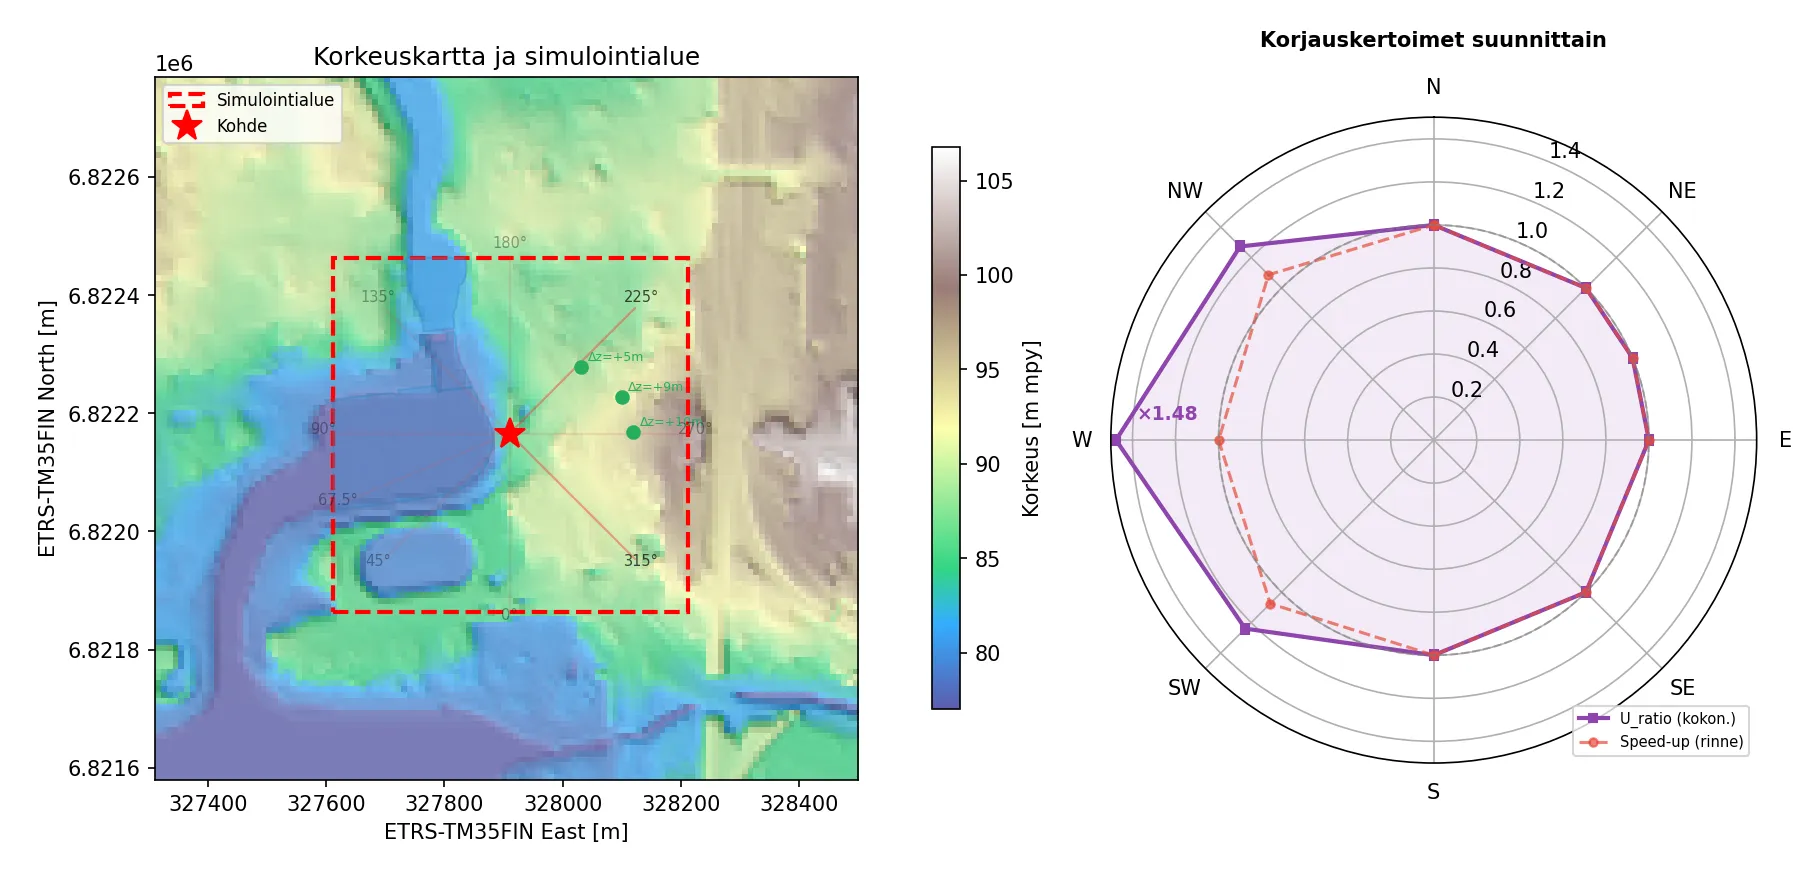

HOW DOES THE SIMULATION WORK?
Microclimate simulation is based on the building's actual location and its surroundings. The shapes and positions of the buildings are generated automatically from map data, after which the air movement around the building is modelled with physics-based computation.
The simulation takes into account the direction and strength of the wind, as well as how the air accelerates, slows down and swirls around buildings, corners, facades and trees. The computation is refined especially close to the buildings, where stress typically arises.
The result is clear visualisations that help identify local risk areas. The method is not based on general assumptions. Every analysis is always property-specific.
“The simulation does not replace a detailed condition survey, but it quickly shows where further investigations should be focused.”
Make the invisible visible
The stresses caused by the microclimate are not visible from the outside, but they constantly affect the condition of the property. A microclimate simulation shows which parts of the building the microclimate stresses most and where further investigations should be focused.
Choose the calculation area and the simulations below. For the order we need the property's address and billing details.
Order a microclimate simulation
The calculation is automated, so the prices are fixed and you know the cost in advance. The report is ready on the next working day. Prices exclude VAT.
We do not share your information with third parties.
Read more about our privacy practices.